
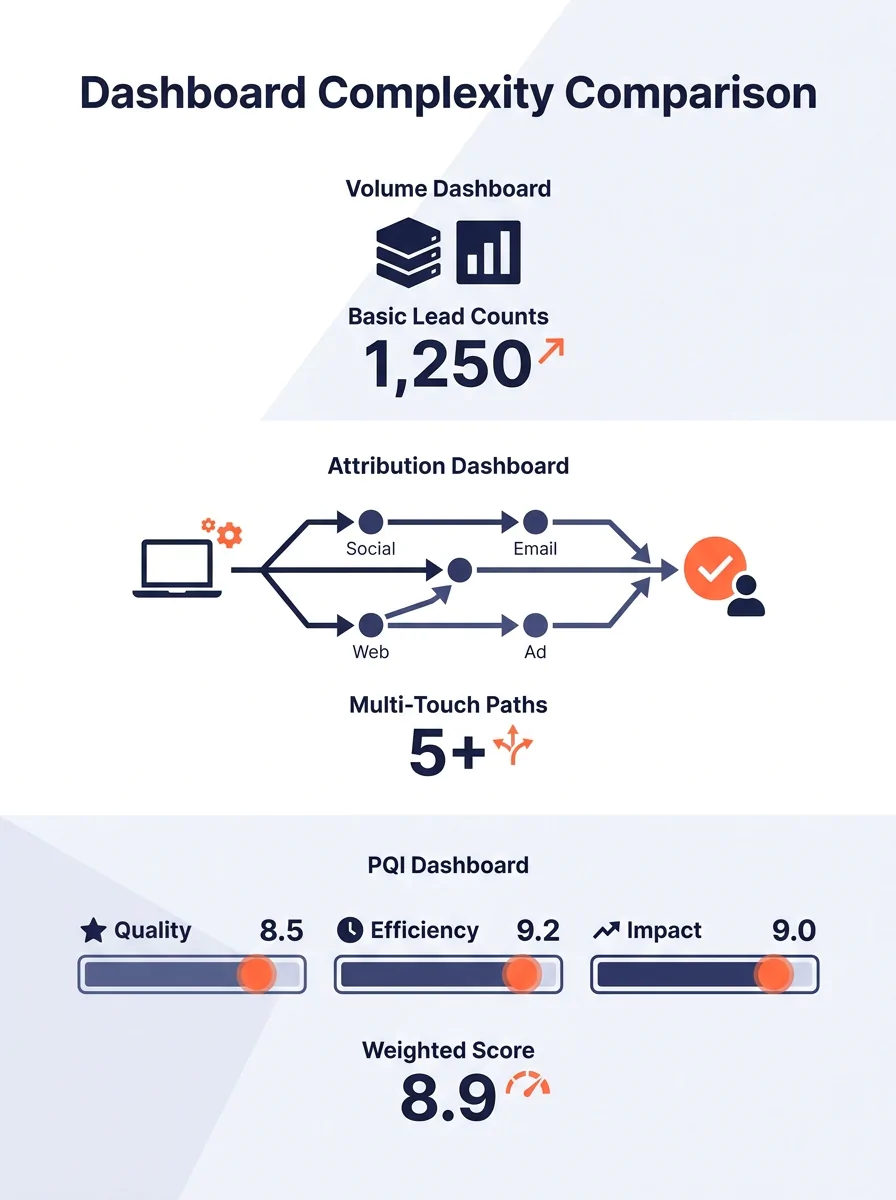
Three dashboard architectures dominate outsourced digital marketing: volume-and-activity trackers, multi-touch attribution platforms, and pipeline quality index (PQI) models. Each handles lead-to-revenue tracking differently, and the wrong choice buries your outsourced team’s real contribution under vanity numbers that feel productive but predict nothing.
TL;DR: Volume dashboards are fast to deploy and easy for offshore teams to populate, but they can’t tell you which leads convert. Attribution dashboards connect spend to revenue but require deep CRM integration. Pipeline Quality Index dashboards produce the clearest measure of outsourced team accountability because they score deals by close probability, though setup cost and data hygiene demands are steep.
| Feature | Volume Dashboard | Attribution Dashboard | PQI Dashboard |
|---|---|---|---|
| Setup time | 1–2 weeks | 4–8 weeks | 6–12 weeks |
| CRM integration depth | Minimal (form counts) | Deep (multi-touch events) | Full (deal stage + revenue) |
| Best metric | Cost-per-lead | Revenue per channel | Weighted pipeline score |
| Lead-to-revenue visibility | None | Partial (channel-level) | Full (deal-level) |
| Outsourced team accountability | Activity-based | Channel-based | Outcome-based |
| Risk of gaming | High | Medium | Low |
| Monthly maintenance | ~2 hrs | ~8 hrs | ~12 hrs |
Volume-and-Activity Dashboards Are the Default for a Reason
Every outsourced marketing engagement starts here. The offshore team stands up a Google Data Studio (now Looker Studio) report within a week, populating it with impressions, clicks, form fills, and cost-per-lead. According to NetSuite’s outsourcing KPI framework, external partner metrics commonly focus on “error rates, cost reduction percentage, and schedule adherence.” That description fits most volume dashboards perfectly: they measure whether the team did the work, not whether the work produced revenue.
The appeal is obvious. Setup takes a week or two. Your offshore team in the Philippines can fill the dashboard without needing CRM admin access. And the numbers always go up, which makes monthly reviews feel productive. If your outsourced team runs paid media, you’ll see spend, impressions, click-through rates, and leads generated. If they handle SEO, you’ll get keyword rankings, organic sessions, and form submissions.
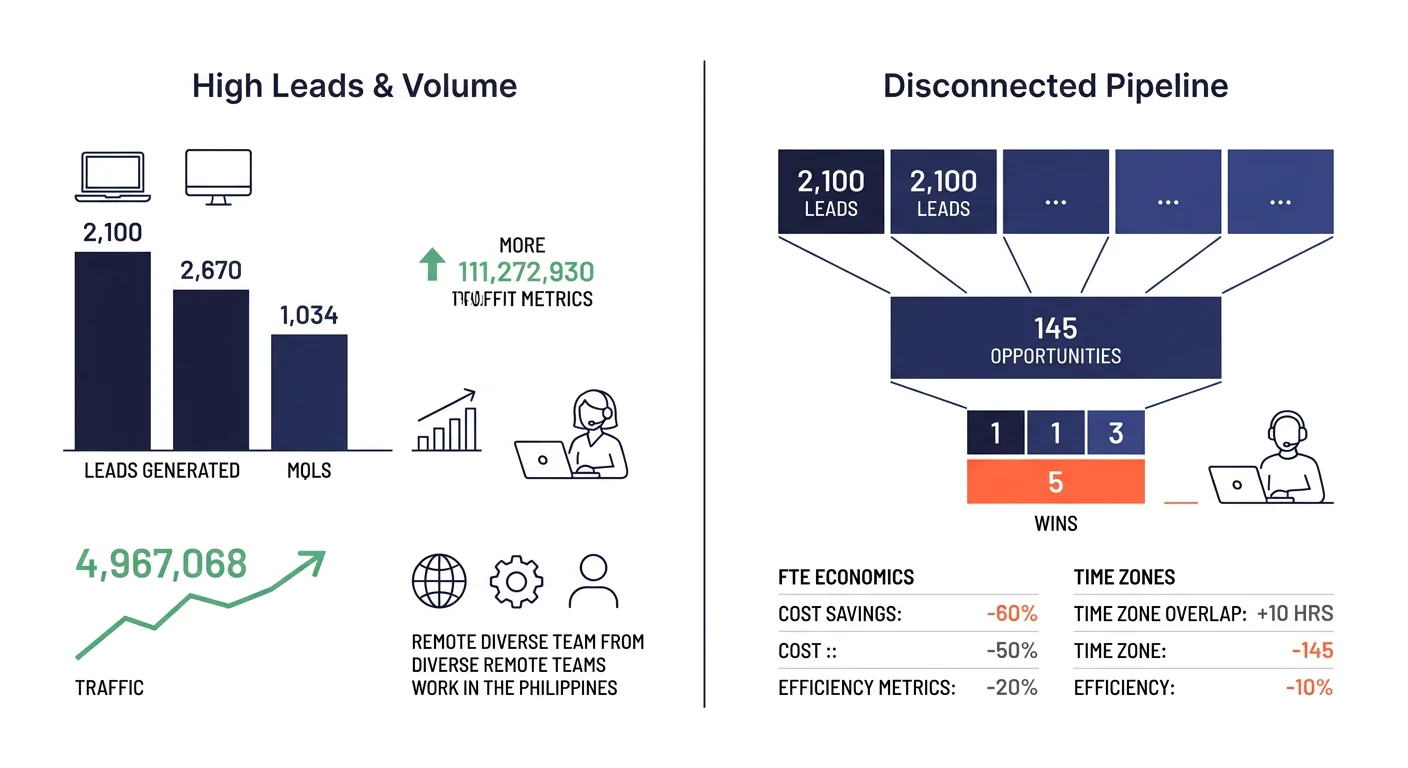
The problem surfaces when you try to tie any of those numbers to closed deals. A dashboard showing 340 leads this month looks healthy until your sales team reports that 290 of them were unqualified. Pipeline quality metrics like conversion rates at each stage, deal velocity, and win rates are completely absent from this model. As Qlik’s marketing KPI guide puts it, “KPIs and metrics help employees track their progress and help managers move things along to ensure that everyone provides value.” Volume dashboards track progress but offer no mechanism for evaluating value.
When your outsourced team accountability model runs on leads generated, the predictable result is lead inflation. The team optimizes for the number they’re measured on. Cost-per-lead drops, lead volume rises, and sales pipeline health deteriorates because nobody is filtering for fit.
If you’ve already worked through which digital marketing tasks to keep in-house versus offshore, you already know the split. Volume dashboards work fine for execution tasks like content production throughput or ad creative rotation. They fail the moment you need to answer the question every founder actually cares about: did this spend create revenue?
Attribution Dashboards Fix Channel Blindness but Miss Deal Quality
Multi-touch attribution dashboards connect marketing spend to revenue outcomes by tracking every interaction a buyer has before becoming a customer. Tools like HockeyStack, Cometly, and Ruler Analytics map touchpoints across channels and assign fractional credit to each. According to HockeyStack’s attribution dashboard guide, effective setups include “month-to-date and month-on-month performance reports that show metrics such as ad spend, Sales Qualified Leads (SQLs), pipeline, and revenue in real time.”
This is a substantial upgrade from volume-only reporting. Revenue attribution dashboards, as wetracked.io’s 2026 tool comparison describes, “connect campaigns directly to leads, sales, customer acquisition costs, and revenue outcomes.” Your outsourced digital marketing team can now demonstrate that a specific Google Ads campaign generated $47,000 in pipeline, not just 83 leads.
An attribution dashboard tells you which channels produce revenue. A PQI dashboard tells you which deals in your pipeline are actually going to close.
For agencies and SMBs working with Philippine marketing teams, this model introduces real digital marketing outsourcing KPIs tied to business outcomes. Your monthly review shifts from “we generated 400 leads at $12 each” to “paid search generated $180,000 in attributed pipeline at a 4.2x return on ad spend.” That conversation changes how you evaluate your outsourced team entirely.
But attribution dashboards have a structural gap. They answer which channel produced a deal, not how likely that deal is to close. A $50,000 opportunity attributed to a LinkedIn campaign looks identical in the dashboard whether it’s a tire-kicker or a contract-ready buyer. The dashboard credits the channel at opportunity creation, and the deal might sit in your pipeline for nine months before dying. Pipeline coverage ratios, which CaptivateIQ defines as “the value of opportunities compared to quota,” aren’t native to most attribution tools.
Setup is also considerably heavier. Your CRM needs clean multi-touch tracking, UTM discipline across every campaign, and bi-directional data sync between ad platforms and your pipeline. If you’ve worked with offshore teams on aligning KPI frameworks for remote staff, you know that data hygiene is a daily discipline, not a one-time configuration. Attribution dashboards require 4–8 weeks to stand up properly and roughly 8 hours of monthly maintenance to keep accurate.
Pipeline Quality Index Dashboards Weight What Actually Closes
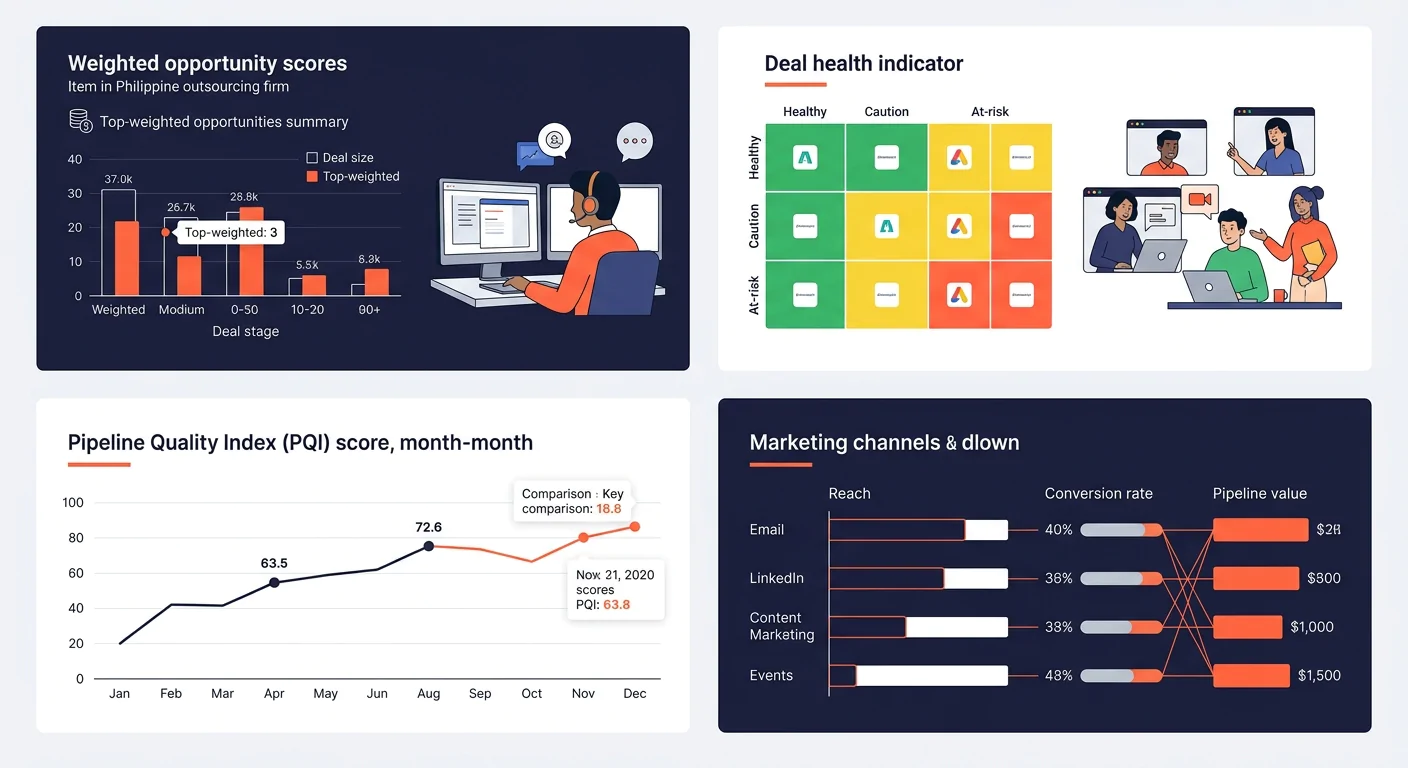
PQI dashboards score every opportunity in your pipeline using a weighted formula that predicts revenue probability, not just attribution credit. Monetizely’s pipeline quality framework proposes a baseline formula: “PQI = (Opportunity Score × 0.3) + (Data Integrity × 0.3) + (Conversion Performance × 0.4).” This produces a single number that executives can track over time and compare across campaigns, channels, and team members.
The three components address distinct failure modes. Opportunity Score evaluates deal fit against your ideal customer profile (ICP). Data Integrity checks whether the CRM record is complete, with all required fields populated and activity logged. Conversion Performance tracks historical stage-to-stage progression rates for similar deals. Together, they answer the question attribution dashboards avoid: given everything we know about this deal, how likely is it to close?
For outsourced team accountability, this model is the strongest of the three. When your Philippine marketing team is scored on pipeline quality rather than volume, the incentive structure flips. Generating 50 high-PQI leads becomes more valuable than generating 300 unqualified form fills. Successful ABM programs using target-account pipeline metrics report 25–40% of total pipeline coming from target accounts within six months, with 15–25% shorter sales cycles and 20–40% larger average deal sizes compared to non-targeted accounts.
Lead-to-revenue tracking becomes granular. You can evaluate your outsourced team by PQI per channel, PQI trend over time, and PQI variance between campaigns. If your offshore paid media specialist runs two campaigns and one produces leads with an average PQI of 72 while the other sits at 41, you have a concrete basis for reallocating budget.
Warning: PQI dashboards require your sales team to consistently update deal stages and log activities in the CRM. If your pipeline data is messy, the PQI score will be unreliable. Budget 6–12 weeks for setup, including a CRM audit and data hygiene protocol.
The tradeoff is real. PQI dashboards take 6–12 weeks to configure properly, require full CRM integration (not just marketing automation), and demand ongoing data discipline from both your sales team and your outsourced marketing staff. If you’re still sorting out how to structure strategy and execution responsibilities between in-house and offshore teams, adding a PQI layer too early creates more confusion than clarity.
Which Dashboard Fits Your Outsourcing Model
The honest answer depends on two variables: your CRM maturity and how far into the outsourcing relationship you are.
Month 1–3 of an outsourcing engagement: Go with volume-and-activity dashboards. Your offshore team needs to prove execution reliability before you layer on revenue accountability. Track output metrics (content pieces published, campaigns launched, ad spend managed) alongside basic lead counts. This builds the operational trust that makes deeper integration possible. If you’re scaling up a Philippine digital marketing team and navigating the early days of ad platform changes, volume dashboards give everyone a shared scoreboard without requiring months of CRM work.
Month 4–9 with clean CRM data: Move to attribution dashboards. By this point, your outsourced team understands your ICP, your UTM conventions are consistent, and your CRM has enough historical data to make attribution meaningful. The shift from “leads generated” to “pipeline attributed to channel” is the single biggest upgrade in outsourced team accountability for most SMBs and agencies. Visitor-to-lead conversion benchmarks of 1.5–2.6% (with 5%+ as world-class), combined with 2.6% for organic SEO leads, give you realistic targets to set for your offshore team.
Month 10+ with sales team buy-in: Layer in PQI scoring. This works only if your sales team is disciplined about updating deal stages and your CRM data integrity is solid. The payoff is significant: you can measure your outsourced team’s contribution to weighted pipeline, not just raw pipeline value. Account-centric reporting that tracks 40–70% monthly engagement on target accounts and 3+ mapped buying roles on 60% of those accounts predicts conversion far better than any volume metric.
And the three aren’t mutually exclusive. Most mature outsourcing relationships run all three simultaneously. Volume metrics track execution throughput. Attribution metrics track channel efficiency. PQI metrics track revenue probability. Your outsourced team sees volume numbers daily, attribution numbers weekly, and PQI numbers in monthly business reviews.
The mistake most companies make is jumping straight to PQI dashboards before the data infrastructure supports them, or worse, staying on volume dashboards for two years because they’re easy. If your outsourcing economics have already shifted toward AI-assisted workflows, your offshore team has the bandwidth to help manage attribution and PQI data hygiene. Use that capacity. The dashboard your outsourced team reports on shapes the work they do. Measure leads, and you’ll get leads. Measure pipeline quality, and you’ll get pipeline that converts.