
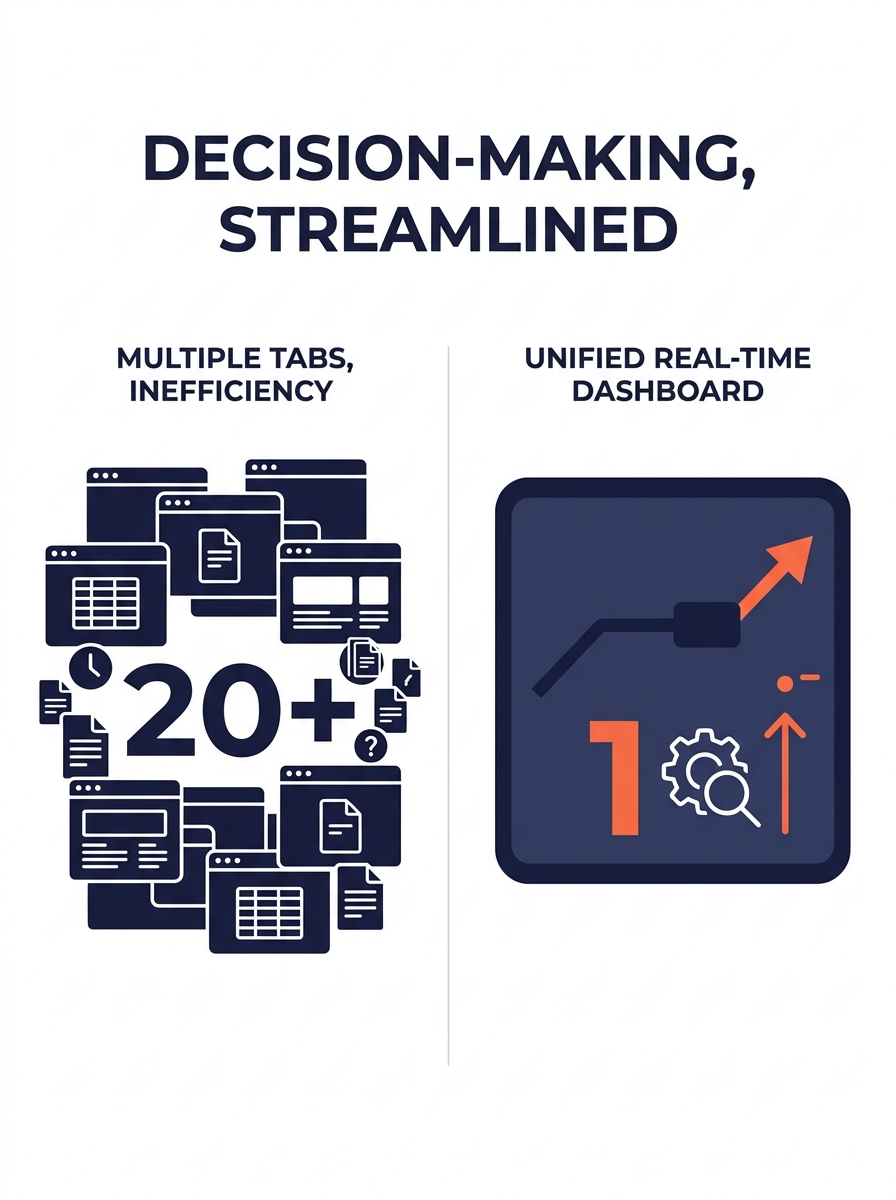
Philippine marketing teams 2026 are pulling real-time marketing analytics from consolidated dashboards while most US in-house teams still toggle between five or six disconnected platforms to reconcile conversion numbers. That speed gap, measured in hours of reaction time per campaign anomaly, is where offshore teams are winning accounts.
Phase One: Five Platforms, Five Logins, One Spreadsheet
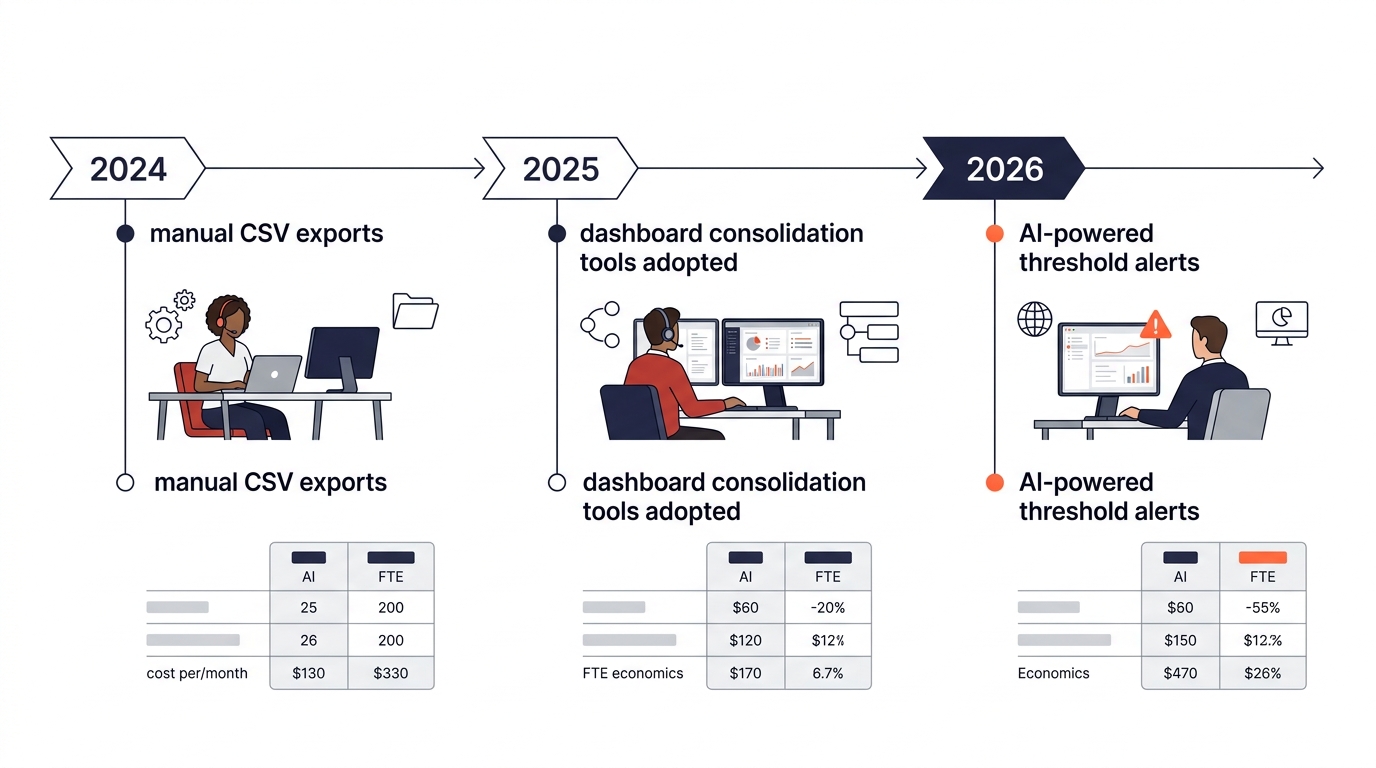
The standard US marketing workflow through 2024 looked like this: a paid media manager logs into Google Ads, pulls a CSV export, copies the numbers into a shared Google Sheet, then does the same for Facebook Ads Manager, then HubSpot, then Google Analytics. By the time every column lines up, 90 minutes have passed. If a campaign’s cost-per-click spiked at 7 a.m., the team doesn’t see it until the 10 a.m. standup.
Improvado’s 2026 analysis of marketing dashboard design describes this environment directly: a marketing dashboard is “a centralized tool that visualizes key performance indicators from various marketing channels like SEO, PPC, social media, and email.” The problem was that most teams in 2024 didn’t have one. They had fragments. A Google Data Studio report here, a HubSpot dashboard there, and a spreadsheet stitching them together with manual exports.
Philippine digital marketing teams working for US clients saw the same fragmentation from the other side of the brief. We’ve written about how poorly structured briefs cause outsourced marketing to fail before day one, and reporting fragmentation was a close cousin of that problem. When your offshore team can’t see live campaign data, they default to weekly PDF reports that arrive already stale.
The Consolidation Window: 2025’s Dashboard Boom
Two things happened in 2025 that changed the economics of offshore digital marketing dashboards. First, tools like Cyfe dropped pricing to a level where small businesses and startups could assemble functional dashboards without custom development. As Cometly’s 2026 dashboard guide notes, Cyfe’s “pre-built widgets for major platforms, including Google Analytics, Facebook Ads, Twitter, and Instagram, mean you can assemble a functional dashboard quickly without custom configuration.” A $19/month tool eliminated the excuse that real-time reporting required enterprise budgets.
Second, Philippine BPO firms started standardizing on communication and project management stacks that integrated with these dashboards. The offshore marketing services playbook from Versatile documented the pattern: “Use Slack or Teams for real-time syncs, and ClickUp or Asana for project tracking. Establish KPIs and reporting cadence. Agree on clear metrics like conversion rate, traffic growth, and cost per lead.”
That combination, cheap dashboards plus structured communication protocols, opened a window. Philippine teams that moved fast through it gained a structural advantage: they could react to campaign data within minutes, not days. US in-house teams running the same campaigns with the same budgets were still waiting for their weekly agency report.
The time zone math actually helped. A Philippine team working 12-13 hours ahead of Pacific Time could catch a Google Ads anomaly during their morning, flag it in Slack, and have a fix deployed before the US client woke up. Performance transparency outsourcing went from a theoretical selling point to a measurable operational advantage.
When Threshold Alerts Changed the Reaction Clock
Why does reaction speed matter so much in paid media? Because ad platforms charge you whether your campaign is performing well or burning money. A cost-per-click spike that goes unnoticed for six hours on a $500/day budget means $125 wasted before anyone intervenes.
Real-time marketing analytics dashboards in 2026 addressed this with threshold-based alerts. Cometly’s analysis of leading dashboard tools highlights that users “can set goals and get notified the moment metrics hit thresholds, whether that’s a spike in CPC or a drop in conversion rate.” Mobile alerts pushed to a Philippine team’s Slack channel at 2 a.m. Manila time (which is 2 p.m. Eastern) gave them the ability to pause a campaign, adjust bidding, or swap creative before the next billing cycle compounded the problem.
Monday.com’s 2026 reporting guide put it plainly: real-time data visualization “converts raw metrics into immediate, actionable insight, helping teams identify trends and irregularities as they emerge.” That description matches what we’ve seen in practice. Teams that build quality-first dashboards for outsourced marketing don’t just report faster. They intervene faster.
The gap between a Philippine team with live alerts and a US agency sending a Monday morning recap is significant. One operates on a 15-minute reaction window. The other operates on a 72-hour one. If you’re paying $5,000/month in ad spend, that difference translates directly to wasted budget or preserved budget.
Teams that build live dashboards don’t just report faster. They intervene faster, and in paid media, intervention speed is the difference between $125 wasted and $125 saved.
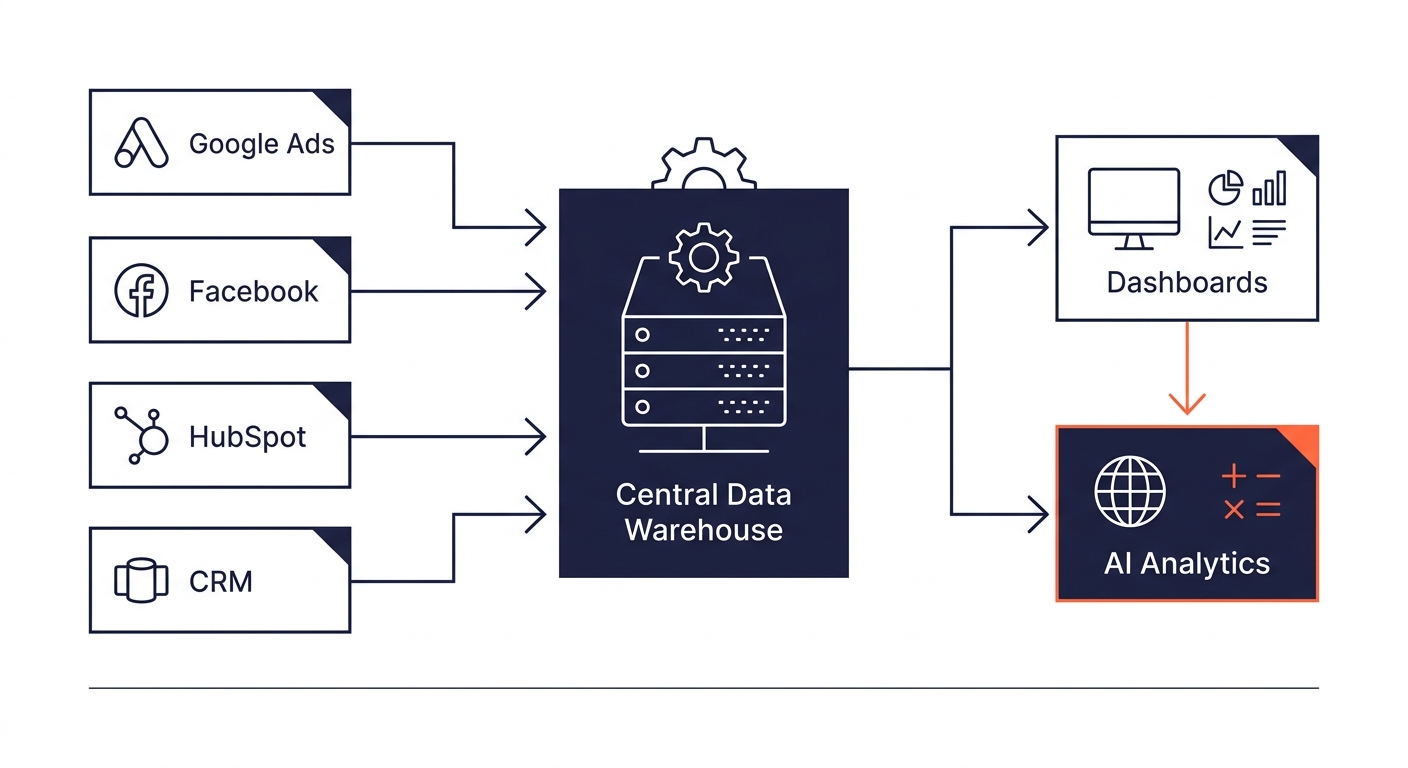
Our recent coverage of paid media transparency rules digs into the specifics: Facebook Ads Manager, Google Analytics, and your CRM will report three different conversion numbers for the same campaign on the same day. The only way to reconcile those numbers in real time is a single dashboard pulling from all three APIs simultaneously. Philippine teams that run this setup can flag discrepancies within a single work session instead of surfacing them in a weekly call.
The AI Acceleration and the Data Foundation Problem
By early 2026, AI-powered analytics features started appearing inside the same dashboard tools Philippine teams were already using. Automated anomaly detection, natural language queries against campaign data, predictive budget allocation. The promise was obvious. The execution hit a wall.
A June 2026 study commissioned by Boomi and conducted by Omdia found that Philippine organizations are rapidly embracing AI, but many risk falling short on returns because their data foundations remain fragmented. The In-House Agency Council’s benchmark study, released the same week, confirmed the pattern across APAC: widespread AI adoption alongside limited operational integration, with marketing teams investing in AI tools faster than they could restructure workflows around them.
Improvado’s 2026 data-driven marketing analysis identified the core fix: the goal is to “eliminate time-consuming manual exports and reduce dependency on engineering, so teams can operate on live, analysis-ready data.” That means a centralized data warehouse (Snowflake, BigQuery, or a similar system) feeding every dashboard and AI tool from a single source of truth, rather than each tool pulling its own partial dataset.
Philippine teams that had already consolidated their dashboards in 2025 were better positioned for this transition. Their data pipelines existed. Their APIs were connected. Adding an AI layer on top of clean, unified data is a different challenge than trying to bolt AI onto five disconnected spreadsheet exports.
The compliance dimension matters here too. Philippine teams running campaigns for US and EU clients need to track consent signals, attribution data, and privacy flags alongside performance metrics. A mid-market e-commerce company with $40 million in annual revenue faces theoretical PECR exposure of $1.6 million for something as routine as a misconfigured email tracking pixel, according to our GDPR compliance analysis. Real-time dashboards that surface compliance anomalies alongside performance data reduce that risk.
How the Modern Offshore Marketing Stack Actually Works
A high-performing offshore marketing team in 2026, as described by Away Digital Teams, includes a dedicated marketing analyst handling “cross-channel performance tracking and reporting, surfacing the insights that drive decisions.” That analyst isn’t compiling reports. They’re monitoring live dashboards, triaging alerts, and escalating anomalies.
The practical stack for a Philippine team running US client campaigns typically looks like this:
| Component | Tool Category | Update Frequency | Cost Range |
|---|---|---|---|
| Dashboard Platform | Cyfe, Databox, or AgencyAnalytics | Real-time (5-15 min refresh) | $19-$99/month |
| Communication | Slack with channel-based alerts | Instant | $7.25/user/month |
| Project Tracking | ClickUp or Asana | Real-time | $7-$10.99/user/month |
| Data Warehouse | BigQuery or Snowflake | Near real-time | Usage-based |
| Attribution | Cometly or Triple Whale | Real-time | $99-$400/month |
The metrics each channel tracks also shift depending on funnel stage. At the consideration stage, teams monitor CTR, CPC, and social engagement. At the decision stage, the focus moves to conversion rate, revenue, CAC, and ROI. Philippine teams that understand this distinction, and build dashboard views matching each stage, deliver reporting that drives decisions rather than filling inboxes.
Teams handling outsourced link building or outsourced WordPress development alongside paid media campaigns benefit from the same consolidated reporting approach. When SEO metrics, site performance data, and ad spend numbers live in one place, the team spots interactions between channels that siloed reporting misses entirely.
Tip: If your offshore team sends you a PDF report on Monday morning, you’re operating on data that’s already 48-72 hours old. Ask for shared dashboard access with threshold alerts instead. The tool cost is under $100/month. The reaction-time improvement is measured in days.
The State of Play
Philippine digital marketing teams that invested in real-time reporting infrastructure through 2025 now sit on a meaningful operational advantage. Their dashboards consolidate data from every channel into a single view. Their alert systems flag anomalies within minutes. Their analysts triage problems during US off-hours, which means the client’s first interaction of the day is a Slack message explaining what happened and what was done about it, not a request to investigate a problem.
US in-house teams and domestic agencies can build the same infrastructure. The tools are identical, available to anyone with a credit card. The difference is labor economics. A US marketing analyst monitoring live dashboards costs $65,000-$85,000/year. A Philippine analyst with the same dashboard access, the same certification stack, and 12-13 hours of coverage during US off-peak hours costs $14,000-$22,000/year. The dashboard subscription adds another $1,200/year. The math isn’t close.
The teams losing ground are the ones still treating reporting as a deliverable instead of an operating system. A weekly PDF report was acceptable in 2023. In 2026, when dashboard tools that track pipeline quality cost less than a single team lunch, there’s no structural reason to wait three days to learn your CPC doubled overnight. Philippine teams figured this out early. The data shows they were right.