
Task completion rate, response time, hours logged, emails sent: the average VA performance dashboard tracks between eight and twelve metrics simultaneously. Roughly half of those numbers measure presence rather than output, and presence tells you almost nothing about whether your Philippine virtual assistant is generating ROI. The mechanism that separates useful virtual assistant KPIs from decorative ones is surprisingly simple. Each metric needs to connect to a dollar figure, a time savings, or a quality standard that your business already cares about. Everything else is noise dressed up as accountability.
This piece breaks down how VA performance measurement actually works under the hood, where most frameworks go wrong, and what the individual components of a working KPI system look like when applied to Philippine VAs.
The Financial Baseline You Need Before Choosing Any Metric
Before you pick a single KPI, you need a number to measure against: the loaded cost of doing the same work in-house. For a US-based administrative hire, that loaded cost (salary, benefits, equipment, office space, management time) runs $55,000 to $75,000 per year. A Philippine VA handling the same task portfolio costs $12,000 to $30,000 annually, depending on specialization and seniority level.
The gap looks obvious on paper. But the ROI calculation isn’t “we saved $40,000.” The real question is: what’s the cost per completed task, and how does the quality of output compare?
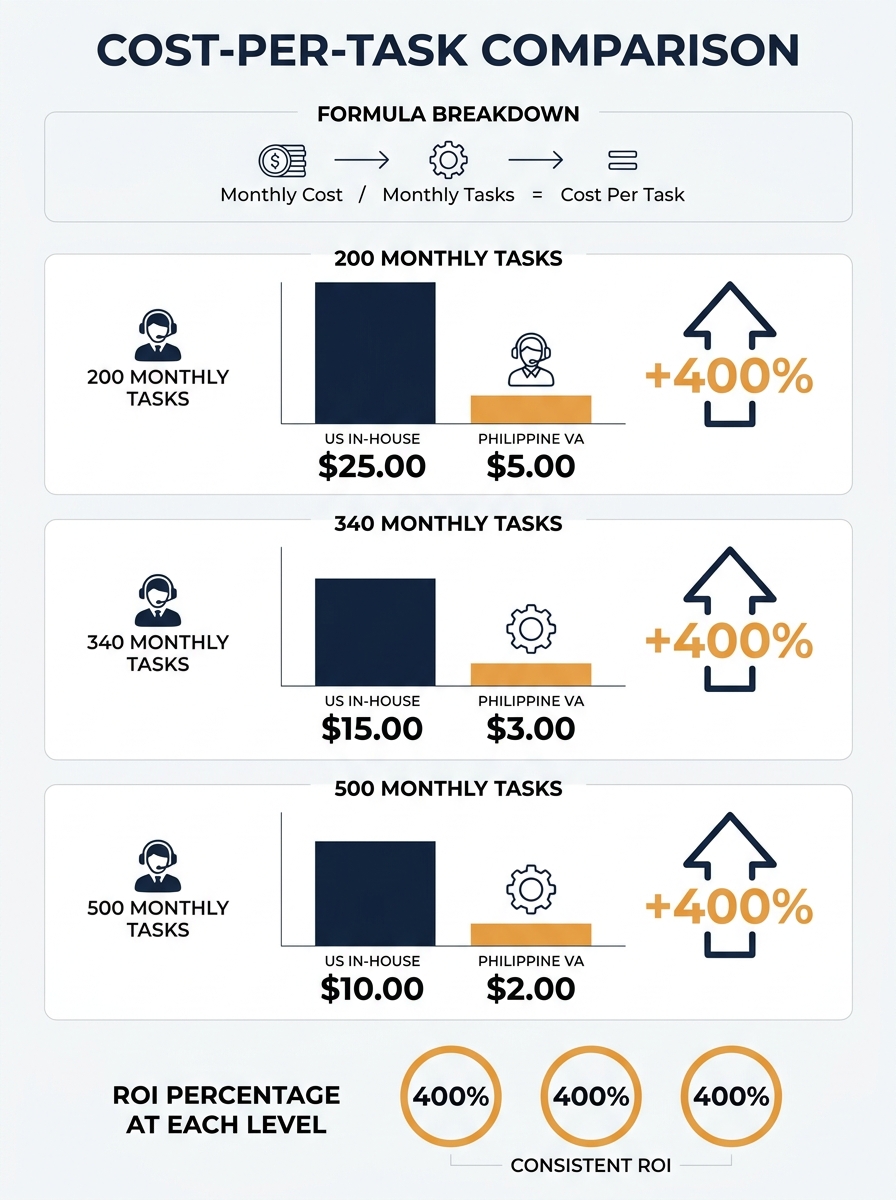
Here’s the formula that actually matters for productivity benchmarking:
Monthly VA cost ÷ number of tasks completed at acceptable quality = cost per task.
If your VA costs $1,800/month and completes 340 tasks at the quality standard you’ve defined, your cost per task is $5.29. Compare that against what the same task costs when handled by a $65K/year employee (roughly $31/hour loaded, multiplied by average time per task), and you have a real ROI figure. As AIVA’s framework puts it, you calculate financial ROI by comparing the costs associated with hiring a VA against the savings or revenue they generate.
This baseline also helps when you’re weighing the outsource-versus-hire decision at different revenue levels. The KPIs you set should prove or disprove whether the cost advantage holds at your specific volume of work.
Why Activity Metrics Fail as Performance Indicators
Activity metrics count motion. Hours logged. Emails sent. Tasks opened. Login times. They’re easy to track, and they feel productive because the numbers are always going up.
The problem is that activity metrics can be gamed without producing any business value. A VA can log eight hours, send 50 emails, and open 30 tasks while accomplishing very little of substance. Worse, activity-based tracking pushes behavior toward volume over impact. Your VA optimizes for the number that’s being watched, and if that number is “hours at desk,” you’ll get hours at desk.
According to research from StaffingSolutions.io, effective VA performance measurement relies on outcome-oriented KPIs like response time, task completion rate, cost per task, and customer feedback scores. Notice that none of those measure presence. They all measure results.
This distinction matters more for offshore teams than for in-house staff because you don’t have the ambient visibility of a shared office. You can’t glance over and see whether someone looks busy. With a Philippine VA working on a shifted schedule to overlap with your business hours, the output itself is the only honest signal you have.
The KPIs you choose signal to your assistant what you value. Outcome-based KPIs signal you value results. Activity-based metrics signal you value presence.
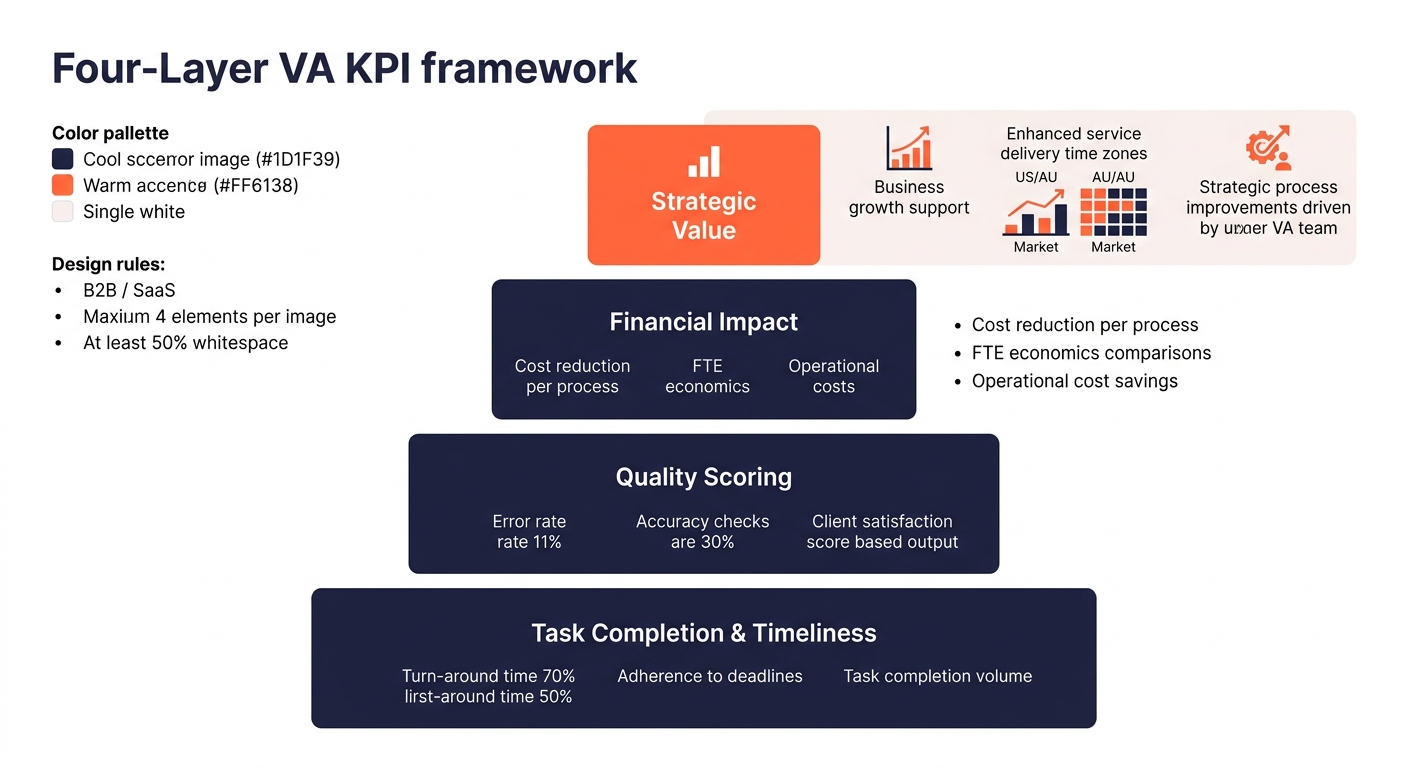
The Four Layers of a Working KPI Framework
Useful offshore team metrics stack in layers. Each layer answers a different question, and you need all four to get an accurate picture of VA performance.
Layer 1: Task Completion and Timeliness
This is the foundation. What percentage of assigned tasks does the VA complete on time? A healthy initial target is 85-90% during the first 60 days, climbing to 93-95% by month four. Rates below 75% usually indicate unclear instructions or task overload rather than poor performance.
Track this in whatever project management tool you already use. If you’re assigning work through Asana, Trello, or Monday.com, the data is already there waiting to be read.
Layer 2: Quality Scoring
Completion without quality is a vanity metric. You need a rubric, and it doesn’t need to be complicated. For an executive assistant, quality might mean: calendar entries have correct time zones, meeting summaries go out within 24 hours, and documents follow the formatting standard. For a Shopify virtual assistant managing product listings, quality means accurate SKUs, properly tagged images, and descriptions that match your brand voice.
Score quality on a simple 1-3 or 1-5 scale during weekly reviews. Track the average over time. A VA whose task completion rate is 95% but whose quality score averages 2.1 out of 5 is creating rework, and rework costs you more than the original task did.
Layer 3: Financial Impact
This is where you connect VA output to revenue or savings. The cost-per-task formula from earlier is one angle. Another: hours recovered. If your VA handles inbox management, scheduling, and travel booking for a founder who bills at $250/hour, and the VA frees up 15 hours per week, that’s $3,750/week in recovered capacity. Against a VA cost of $450/week, the ROI is immediate and measurable.
For revenue-generating roles, tie KPIs directly to business outcomes. An Amazon virtual assistant managing listings should be measured on conversion rate changes, listing accuracy, and review response time, because those metrics connect to actual sales figures.
Layer 4: Strategic Value
The hardest to measure, but often the most important. Is this VA taking work off your plate that allows you to focus on higher-value activities? Are they building institutional knowledge that makes your operation more resilient?
According to research from ExecViva, onboarding speed is a leading indicator of strategic value. A VA who reaches full productivity in 3 weeks versus 8 weeks generates strategic value faster because they’re freeing up your capacity sooner.
How Onboarding Speed Shapes Every Other KPI
Onboarding speed deserves its own attention because it’s the leading indicator that predicts whether every other KPI will hit its target. A VA who takes 8 weeks to reach baseline productivity costs you roughly double the effective monthly rate during that ramp period, because you’re paying full cost for partial output.
Set onboarding milestones that map to your KPI layers:
- Week 1: VA can navigate your tools independently and complete routine tasks without step-by-step guidance.
- Week 2: Task completion rate hits 70% with quality scores above 3 out of 5.
- Week 4: Task completion rate hits 85%, quality scores stabilize, and the VA is flagging process improvements proactively.
If you’ve dealt with the onboarding bottlenecks that slow offshore teams, you know that clear documentation and structured first-week workflows cut ramp time dramatically. The same principle applies to VAs. A well-documented process library can compress onboarding from eight weeks to three.
For role-specific VAs, onboarding benchmarks shift. A real estate virtual assistant handling transaction coordination needs to learn your CRM, your document templates, and your brokerage’s compliance requirements before they’re truly productive. Build those specifics into the milestone timeline rather than assuming a generic ramp curve applies to every role.
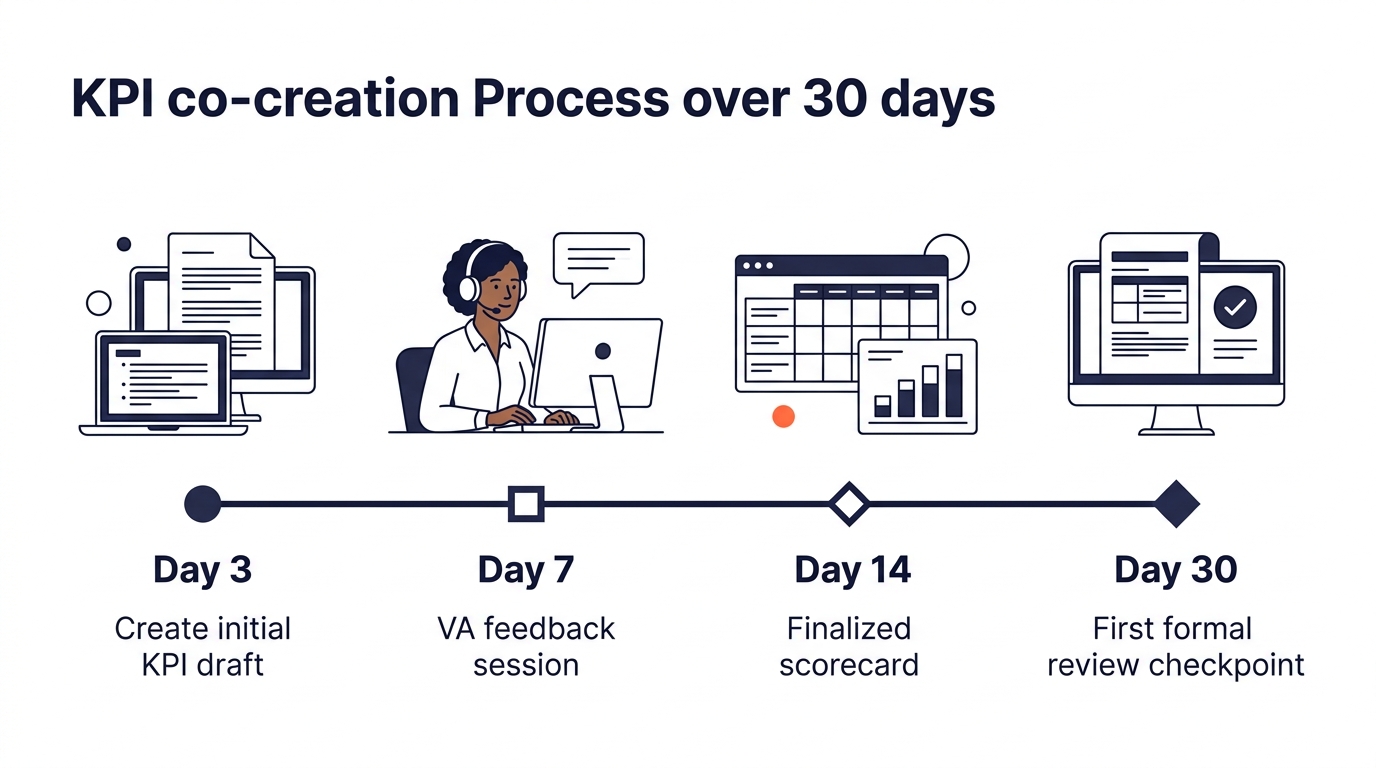
Co-Creating KPIs in the First 30 Days
One of the most common mistakes in outsourcing relationships is handing a VA a finished scorecard and saying “hit these numbers.” It feels efficient, but it produces worse results than involving the VA in defining their own KPIs.
Why? Because the VA knows things you don’t about how long tasks actually take, where bottlenecks live in your processes, and which metrics are easy to game. When you co-create KPIs during onboarding, you get three things. First, realistic targets that account for actual task complexity rather than your estimate of task complexity. Second, buy-in from the VA, who now feels ownership over the goals. Third, early identification of process problems that would otherwise surface as “poor performance” three months from now.
The cadence that works for most teams: a weekly 15-minute check-in during months one and two, shifting to biweekly once the VA is at full productivity. Use the check-in to review KPIs against targets, discuss blockers, and adjust targets if the data warrants it. As outlined by Anywhere Talent’s KPI framework, clear expectations, measurable outcomes, and regular check-ins should be built into the first 30 days so neither the founder nor the assistant is guessing about what success looks like.
Tip: Set a calendar reminder at 90 days to do a full KPI audit. Remove any metric that hasn’t changed your decision-making in three months. If you never looked at it to decide anything, it’s dead weight on your dashboard and your VA’s attention.
Where The Model Breaks
This framework has real limitations, and pretending otherwise would waste your time.
It breaks when task volume is too low. If your VA handles 20 tasks per month, statistical variation makes completion rates meaningless. An 85% rate sounds solid until you realize it means the VA missed 3 tasks, and maybe two of those were because you sent unclear instructions on a Friday afternoon. At low volumes, qualitative judgment matters more than quantitative KPIs.
It breaks when you measure the wrong layer. A common failure mode: tracking Layer 1 (task completion) obsessively while ignoring Layer 2 (quality). The VA hits 97% completion, everyone celebrates, and six months later you discover that 30% of the completed work needed rework. The rework cost erased most of your savings.
It breaks when KPIs become static. Your business changes. Your VA’s role evolves. The KPIs you set in month one might be irrelevant by month six. If you’re not reviewing and adjusting the framework quarterly, you’ll end up optimizing for metrics that no longer connect to business outcomes.
It breaks when the relationship is adversarial. KPIs are a shared language for alignment, not a surveillance apparatus. If your VA feels like every metric is a trip wire designed to justify termination, they’ll optimize for the metrics at the expense of the actual work. Recent workforce research suggests that 42% of managers struggle to shift from monitoring to mentoring, and they fall into exactly this trap. The framework only works inside a relationship where both sides are trying to improve the same outcomes.
The honest version of VA performance measurement acknowledges these failure modes upfront. You’re building a system that gives you better signal than “I think they’re doing fine” or “I’m not sure what they do all day.” Perfect measurement was never the goal. Better decisions, made faster, with real numbers behind them: that’s what a working KPI framework actually delivers.